使用R完成Kmeans聚类
当前,大数据分析等技术浪潮凶猛来袭,正在加速各类数据分析师对数据分析技术的提高。那么,数据分析师到底如何有效迎接呢,就拿R语言来说吧,如何用R语言完成kmemnsne,下面就说一下!
newiris <- iris;
newiris$Species <- NULL; #对训练数据去掉分类标记
kc <- kmeans(newiris, 3); #分类模型训练
fitted(kc); #查看具体分类情况
table(iris$Species, kc$cluster); #查看分类概括
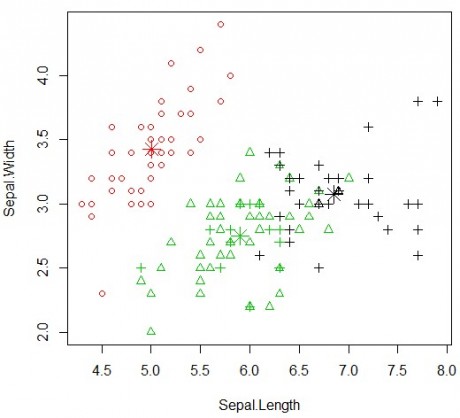
#聚类结果可视化
plot(newiris[c(“Sepal.Length”, “Sepal.Width”)], col = kc$cluster, pch = as.integer(iris$Species)); #不同的颜色代表不同的聚类结果,不同的形状代表训练数据集的原始分类情况。
points(kc$centers[,c(“Sepal.Length”, “Sepal.Width”)], col = 1:3, pch = 8, cex=2);
聚类结果可视化图如下
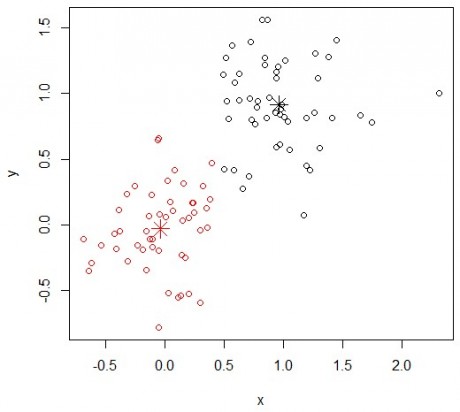
数据分析师:R帮助文档中有一个非常好的例子,如下,特别留意kmeans方法满足的条件:
require(graphics)
# a 2-dimensional example
x <- rbind(matrix(rnorm(100, sd = 0.3), ncol = 2),
matrix(rnorm(100, mean = 1, sd = 0.3), ncol = 2))
colnames(x) <- c(“x”, “y”)
(cl <- kmeans(x, 2))
plot(x, col = cl$cluster)
points(cl$centers, col = 1:2, pch = 8, cex = 2)
# sum of squares
# 其中scale函数提供数据中心化功能,所谓数据的中心化是指数据集中的各项数据减去数据集的均值,这个函数还提供数据的标准化功能,所谓数据的标准化是指中心化之后的数据在除以数据集的标准差,即数据集中的各项数据减去数据集的均值再除以数据集的标准差。见http://it.zhans.org/10/1834.htm。
ss <- function(x) sum(scale(x, scale = FALSE)^2)
## cluster centers “fitted” to each obs.:
fitted.x <- fitted(cl);
head(fitted.x);
resid.x <- x – fitted(cl);
## Equalities : ———————————-
cbind(cl[c(“betweenss”, “tot.withinss”, “totss”)], # the same two columns
c(ss(fitted.x), ss(resid.x), ss(x)))
# kmeas聚类满足如下条件
stopifnot(all.equal(cl$ totss, ss(x)),
all.equal(cl$ tot.withinss, ss(resid.x)),
## these three are the same:
all.equal(cl$ betweenss, ss(fitted.x)),
all.equal(cl$ betweenss, cl$totss – cl$tot.withinss),
## and hence also
all.equal(ss(x), ss(fitted.x) + ss(resid.x))
)cda数据分析师培训
聚类结果可视化图如下
CDA数据分析师考试相关入口一览(建议收藏):
▷ 想报名CDA认证考试,点击>>>
“CDA报名”
了解CDA考试详情;
▷ 想学习CDA考试教材,点击>>> “CDA教材” 了解CDA考试教材;
▷ 想加入CDA考试题库,点击>>> “CDA题库” 了解CDA考试题库;
▷ 想了解CDA考试含金量,点击>>> “CDA含金量” 了解CDA考试详情;
▷ 想了解CDA院校合作,点击>>> “院校合作” 了解咨询CDA院校合作;


 京公网安备 11010802034615号
经营许可证编号:京B2-20210330
京公网安备 11010802034615号
经营许可证编号:京B2-20210330